Memory Leaks on Linux: Why They Break Stability and Quietly Erode Security

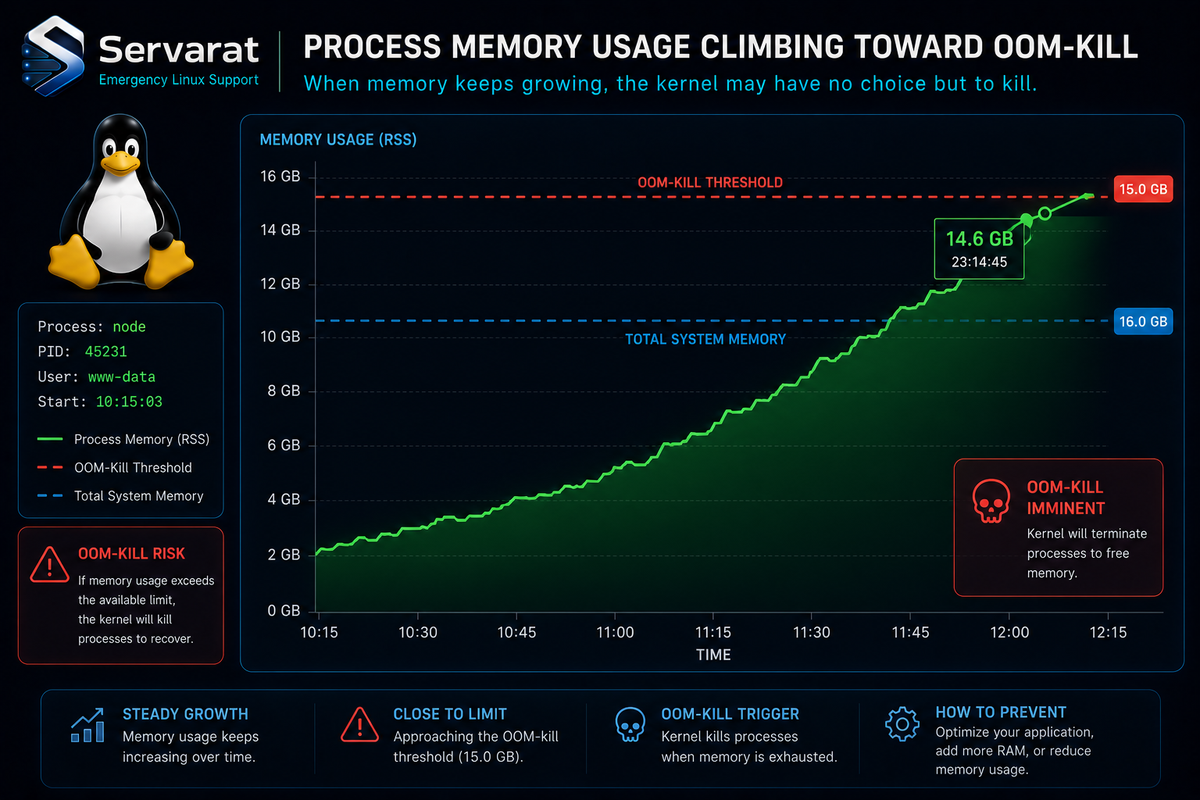
A process with a steady workload shouldn't keep growing its resident memory. When it does, the first question isn't "how much RAM is free." It's "where did allocations stop being released." And on Linux that's rarely obvious from the outside, because three layers — the kernel, the allocator, and the application — each shape what memory usage looks like before you ever see a number in top.
Telling a real leak apart from normal allocation behavior takes more than watching top or a container dashboard. Heap growth, allocator caches, mapped regions, and process lifetime all bend the picture. A climbing RSS might be a leak. It might also be fragmentation, an unbounded cache, or just memory the allocator hasn't handed back to the kernel yet. The useful evidence comes from understanding how Linux manages process memory and pointing the right profiler at the allocation. That's where this starts.
What a Leak Actually Is, at the OS Level
A leak is a program asking the allocator for memory via malloc() and never giving it back via free(). The allocator keeps the block marked live, and the kernel has no way to know it's functionally dead once the application drops its pointer to it.
Underneath malloc(), the request goes to an allocator — usually glibc's ptmalloc-derived implementation, though latency-sensitive services often swap in jemalloc or tcmalloc. With glibc, small and medium allocations come from heap arenas backed by brk()/sbrk(), while large ones are served through anonymous mmap() regions, with the cutoff dynamically adjusted in modern glibc rather than fixed. Either way, the kernel maps virtual addresses first and delays committing physical RAM until first touch, via a page fault.
From the kernel's view, the process owns that virtual range whether or not anything still needs it. Whether a page stays resident, gets swapped, or gets reclaimed follows normal virtual-memory rules and current pressure — not whether your code still holds a pointer. With a valid pointer, the program can release through free() or munmap(). Without one, the allocation is unrecoverable until the process exits.
That's the distinction behind a pattern every admin sees in top or htop: the gap between VIRT and RES. VIRT is the total virtual address space mapped — good for spotting address-space growth or mmap() leaks, useless as a measure of physical pressure. RES is the resident set, the actual RAM behind the mapping. A process whose RES keeps climbing for hours or days, well past where its workload should have settled, is the most basic leak signature on Linux. This is also why I keep arguing that memory belongs on a graph over time, not read as a one-off number — the same case I made in why PSI beats load average for spotting real pressure. A single snapshot hides the slope, and the slope is the whole story.
Where Leaks Come From in Server Software
A handful of recurring patterns account for most of them:
- malloc/free mismatches in error paths. The classic C/C++ leak: a function allocates a buffer, hits an early
returnon failure, and skips the cleanup that only runs on the success path. It only manifests when that failure path gets exercised, which is exactly why testing misses it. - File descriptor leaks. A socket or file opened without a matching
close()eventually hitsulimit -n, but the cost starts long before the limit. Each open descriptor keeps kernel structures alive behind it: socket buffers, dentry and inode references, epoll registrations. mmap()leaks. A process maps a file or shared segment and nevermunmap()s it. VIRT grows with no matching RES jump — which trips up anyone assuming RES tells the whole story.- JVM reference retention. Common in Kafka, Elasticsearch, Cassandra. Objects stay reachable through static collections, listeners never removed, or classloaders piling up across redeploys. The GC is doing its job — keeping reachable things alive — even when "reachable" is itself the bug.
- Leaks inside managed runtimes. GC doesn't grant immunity. In Python, C extensions like numpy or pandas manage memory outside the collector's reach, so a leak there is invisible to
gc.collect(). In Go, a goroutine blocked forever on a channel that never receives holds every variable it captured for the life of the program. - Connection pool exhaustion. A DB connection checked out and never returned drains the pool over time, and each one still holds buffers, prepared-statement caches, and protocol state.
Detecting and Diagnosing
The investigation moves through four stages: spot the trend, rule out look-alikes, find the code, confirm after the fact.
Spotting the trend. top/htop sorted by memory is the first signal; ps aux --sort=-%mem confirms which process is climbing. /proc/[pid]/status gives quick VmRSS and VmHWM indicators. For mapping-level accuracy — especially where shared pages matter — /proc/[pid]/smaps or smaps_rollup break memory down by individual mapping, separating a heap leak from a mapped-file or shared-library one. On hosts running many similar daemons, plain RSS double-counts shared pages, which is where smem and its proportional set size (PSS) give an honest per-process number.
Ruling out look-alikes. Not every upward RSS trend is a lost-allocation leak. Fragmentation, unbounded caches, per-thread arenas, and GC heaps that don't return memory to the OS all draw leak-shaped graphs. The fix differs sharply: a true leak needs corrected ownership and lifetime; bloat needs cache limits, heap sizing, or allocator tuning. Misdiagnose this and you'll tune an allocator for hours chasing a bug that's actually in your code.
Finding the code. Valgrind's memcheck with --leak-check=full classifies leaks as "definitely" or "possibly lost," tied to the allocating call stack — but its overhead makes it a staging tool, not something for live traffic. AddressSanitizer and LeakSanitizer, built into gcc and clang, are lighter and belong in CI. For a process already in production, eBPF-based tools are the standard: memleak.py from BCC, or the bpftrace equivalent, hook malloc/free on a live process with far lower overhead than Valgrind and report outstanding allocations without a restart. For the JVM, jmap pulls a heap dump for Eclipse MAT or VisualVM. Go ships pprof in the standard library.
Confirming after the fact. When none of that happens in time, the OOM killer's logs are the diagnostic of last resort. dmesg | grep -i oom or journalctl -k usually shows which process held the most memory when it got killed — useful retroactively, even if it would've helped more a few hours earlier. If you're regularly reconstructing what a process was doing from the outside, the same /proc and process-inspection muscles from practical Linux process management are what you lean on here.
From RSS Growth to the OOM Killer
The kernel's response to pressure follows a general pattern, though the exact path depends on workload, settings, cgroups, and swap. Under pressure Linux reclaims in stages: page cache first, then reclaimable slab, then — depending on config — anonymous memory through swap. As RSS grows, the kernel typically starts with page cache: the clean, easily-recreated pages behind recently-read files, reclaimed by kswapd in the background. This is why low free memory on Linux often isn't a problem — page cache is supposed to fill unused RAM and evicts painlessly.
Trouble starts once page cache has little left to give and the kernel has to reclaim anonymous memory — the heap and stack pages behind running processes, including whatever a leak has piled up. vm.swappiness shapes how aggressively the kernel prefers swapping anonymous memory over evicting file cache, but it doesn't guarantee heap pages get swapped before something is killed; that depends on how much swap exists and how fast pressure builds. This is the stretch where a leaking service feels sluggish rather than broken — right up until reclaim can't keep pace.
Once reclaim and swap can't satisfy demand, the OOM killer picks a victim by oom_score, adjustable per process via /proc/[pid]/oom_score_adj. ⚠️ This matters operationally in a way people underestimate: a leak in one service can get an unrelated process killed, if that process has a less-negative oom_score_adj when the kernel goes hunting. vm.overcommit_memory controls commit accounting and whether large allocations fail early, but it doesn't govern this later reclaim-and-OOM sequence once real pressure exists.
Containers Change the Shape of the Problem
Inside a container the same leak plays out differently, because memory is bounded by a cgroup rather than the whole host — memory.limit_in_bytes under cgroup v1, memory.max under v2. A leaking process usually hits that ceiling well before it touches the rest of the node, and gets killed by per-cgroup OOM handling. In Kubernetes that surfaces as a pod going OOMKilled, visible in kubectl describe pod.
⚠️ And here's the trap: the restart policy that makes containers resilient also makes leaks nearly invisible. Kubernetes restarts the container, RSS resets to baseline, the leak resumes from zero and grows back to the limit, and the cycle repeats. Without memory metrics tracked over time, this reads as an intermittent crash — when it's actually a deterministic leak on a timer set by request rate and the memory limit. This is precisely the failure the right monitoring catches and a restart count never will: graphing per-container memory the way I walked through in monitoring Docker containers in Uptime Kuma, and at fleet scale with a metrics pipeline like the Alloy + Loki + S3 stack, turns "random OOMKilled events" into a visible upward slope you can act on before the page fires.
Sidecars complicate it further. K8s limits are usually per-container, so a leak in a logging sidecar or mesh proxy gets killed independently of the main app. Newer clusters can set pod-level limits (now beta, enabled by default) giving the whole pod a shared ceiling. Either way, a sidecar with no limit can still draw from the node's general pool, putting unrelated pods at risk of eviction.
The Security Implications Go Past Data Exposure
Leaks create three kinds of exposure, and the obvious one isn't the most interesting.
1. Denial of service. The most direct risk, and a recognized attack class — CWE-401, "Missing Release of Memory after Effective Lifetime" — not just sloppy code. An attacker who finds a request pattern that reliably hits a code path missing a free() can repeat it to push a service toward its limit on purpose. The HTTP/2 Bomb attack is better framed as resource-amplification DoS than a classic leak, but the shape is the same: a small amount of attacker-controlled input forces disproportionate server-side consumption, and the outcome looks identical to an organic crash unless someone's watching for it.
2. Data exposure — but more specifically than usually claimed. A true leak and a failure to scrub sensitive data before freeing it are related but distinct. The risk with leaks specifically is duration: a buffer holding a credential, session token, or request body that should have lived for milliseconds instead sits resident for hours or days because nothing freed it. That extended lifetime widens the window in which an unrelated bug — an out-of-bounds read, a core dump, a swap file persisted to disk — can expose data a properly managed allocation would never have stuck around long enough to leak.
3. The quiet one: your security tooling competes for the same RAM. ⚠️ This is the implication most teams miss. auditd, intrusion-detection agents, and log shippers draw from the same memory as everything else, and get throttled or killed under the same pressure a leak creates — unless their oom_score_adj is explicitly protected. The moment a host is under maximum pressure, often because something is leaking, is exactly when its own defenses are least likely to be running. If you've hardened services with systemd, the same sandboxing cookbook is where you'd also pin OOMScoreAdjust for your security daemons — I covered the unit-level controls in the systemd hardening cookbook. Protecting the watchdog's memory priority is as much a part of hardening as locking down its filesystem access.
Open Source Daemons and the Kernel
Widely deployed daemons — Redis, Nginx, PostgreSQL, Apache — have all had real leak issues tied to specific configs or malformed input, documented in changelogs and trackers. Open source means they get found and patched fast. It also means affected versions are public, which makes patch prioritization a genuine operational task rather than guesswork — because anyone, attacker included, can read the same changelog.
"Linux memory leak" sometimes means something inside the kernel itself, typically a driver rather than a core subsystem. These are harder to see because user-space tools have no visibility into kernel memory — the gap kmemleak was built to fill, with slabtop offering a lighter way to watch slab-cache growth.
Preventing Leaks Before They Ship
Ownership discipline plus runtime-specific guardrails:
- C/C++: RAII and smart pointers where possible, explicit cleanup on every error branch, sanitizers in CI rather than run only when something's already wrong.
- Go:
context.Contextcancellation to bound goroutine lifetimes, no unbounded goroutine creation in handlers, routinepprofprofiling. - JVM: bounded caches, deregistered listeners, no static registries retaining request-scoped objects.
- Python: context managers, explicit closes over GC timing,
tracemallocfor Python-level allocations — with native-extension memory watched separately, sincetracemalloccan't see it.
What to Actually Alert On
The most useful signal is a trend, not a threshold. A single memory number tells you almost nothing; the slope over hours and days tells you almost everything. Worth alerting on:
- A sustained positive RSS slope after warm-up.
- Climbing cgroup memory independent of request volume.
- Repeated restarts or
OOMKilledevents on the same workload. - A growing file-descriptor count.
- Divergence between an app's own heap metrics and total process/container RSS — the one that catches native-extension and off-heap leaks a runtime's own instrumentation never sees.
A Practical Flow
When something looks like a leak, order of operations matters:
- Confirm the trend with RSS, cgroup memory, or process metrics over time — not a single snapshot.
- Separate heap growth from mapping growth with
smapsorsmaps_rollup. - Check FD counts via
/proc/[pid]/fdorlsofto rule out an fd leak. - Match the tool to the runtime: Valgrind or a sanitizer build for C/C++, a heap dump for JVM,
pproffor Go,tracemallocfor Python. - Check OOM evidence via
journalctl -k,dmesg, or Kubernetes pod events to confirm the responsible process.
Treat Memory as a First-Class Metric
The teams that catch leaks early are the ones already graphing RSS over time for long-running services, the same way they graph CPU and disk. A leak announces itself there as a line that never comes back down between deploys — well before it becomes an incident. Memory tends to get treated as a fixed quantity that's either fine or not, rather than a trend worth watching, and long-running Linux infrastructure punishes that assumption eventually, usually at the worst possible time.