Cheap Kubernetes Logging That Scales: Alloy + Loki + S3

Centralized logging on Kubernetes has a way of turning into your most expensive observability line item. The usual culprit is the index. Elasticsearch-style stacks index every word of every log line, and that full-text index can balloon to roughly the size of the raw data it's indexing. You end up paying database prices to store — and re-store, in the index — logs you'll grep through maybe once.
There's a leaner pattern, and Soumen Bhattacharjee, a DevOps engineer, has put together a clean, end-to-end proof-of-concept of it on GitHub: Grafana Alloy for collection, Loki for label-only indexing, and S3 for the bulk log storage. What makes the repo worth a look is that it's not a toy — it wires up real S3 (not a local MinIO stand-in), ships a sample microservice with a load generator so there's actual traffic from minute one, and ends with the notes you need to take it from a local cluster to EKS.
This walkthrough covers what the pipeline does, why each piece is there, and how to reason about the central tradeoff before you adopt it.
The Shape of the Pipeline
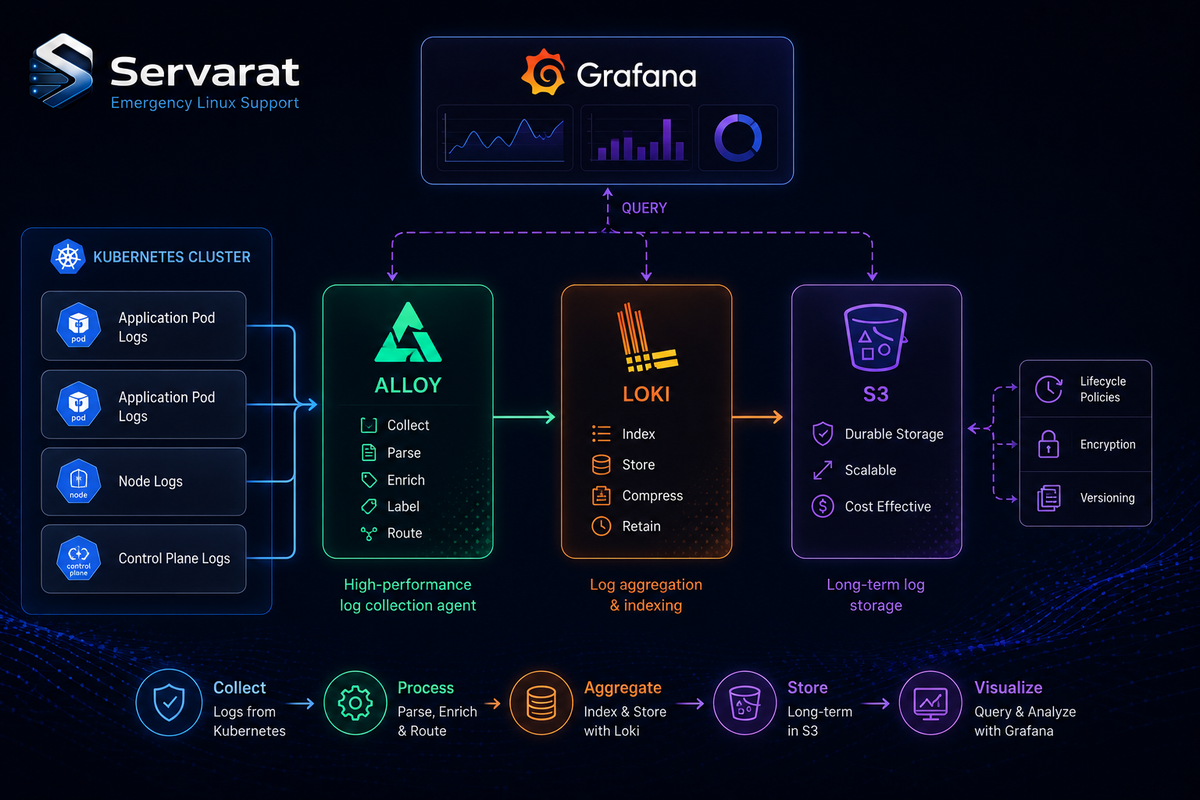
checkout-service (stdout)
  -> Alloy (DaemonSet, 1/node)
    -> Loki (indexes labels only, compresses to chunks)
      -> S3 (durable chunk storage)
        <- Grafana (LogQL queries, dashboards)
Four moving parts, each with one job:
- Grafana Alloy runs as a DaemonSet — one pod on every node — scraping container stdout and tagging each line with labels like
namespaceandpod. - Loki indexes only those labels, compresses the raw log lines into chunks, and ships them off to object storage.
- S3 holds the compressed chunks: cheap, durable, and effectively unlimited without capacity planning.
- Grafana sits on top for LogQL queries and dashboards.
Why Each Component Is There
Why Alloy has to be a DaemonSet
Logs are written by containers scattered across every node in the cluster. A node-local collector has to live on each node to read them, which is exactly what a DaemonSet guarantees — one collector pod per node, scheduled automatically as nodes come and go. Run it any other way and you get blind spots on the nodes you missed. The POC even gives you the command to confirm the guarantee held:
kubectl -n logging get pods -l app.kubernetes.io/name=alloy
One pod per node, or something's wrong.
Why Loki indexes labels, not content
This is the architectural heart of the whole thing. Instead of building a full-text index over every token in every log line, Loki indexes a small set of labels — namespace, pod, app, and so on — and stores the actual log content as compressed chunks in object storage.
The index stays tiny. The bulk data lives somewhere cheap. That's the entire cost argument: you're not paying to maintain a massive inverted index that rivals your raw log volume in size.
Why S3 instead of a database
Object storage is roughly an order of magnitude cheaper per GB than database-backed storage, and it scales without you provisioning anything. You don't size it, you don't shard it, you don't plan capacity — you just keep writing chunks and S3 keeps taking them. For write-heavy, read-occasionally data like logs, that's the right storage class.
The Tradeoff You're Actually Making
No free lunch here, and the repo is honest about it. Because Loki only indexes labels, any query that filters on log content — not labels — does a literal scan over decompressed chunks rather than hitting an instant full-text index. A broad content search across a huge time range will be slower than the Elasticsearch equivalent.
⚠️ This is the decision point, so be clear-eyed about it. Loki wins when your access pattern is "I know the service and roughly when — now let me find the error." You narrow hard by label first (service, namespace, time window), and only then scan content within that small slice. That's how most incident investigation actually works, and on that pattern Loki comes out well ahead on cost.
Loki loses when you genuinely need fast, unscoped full-text search across everything — security forensics hunting an indicator across all services with no idea where or when, for example. If that's your dominant pattern, the cheaper index isn't worth the slower scans, and a full-text stack earns its cost. Match the tool to how your team actually queries logs, not to which one looks cheaper on a storage invoice.
What "Done" Looks Like
The payoff query — and the real proof the architecture is doing what it claims — is confirming that log content is physically sitting in object storage, reachable through a small label index rather than an expensive database:
aws s3 ls "s3://<your-bucket-name>/" --recursive | head -20
And a representative LogQL query in Grafana, narrowing by label before touching content:
{namespace="demo-app", app="checkout-service"} | json | level="error"
Label selectors first (namespace, app), then parse JSON, then filter on a field. That ordering is the whole performance model in one line: shrink the candidate set with the index, then scan what's left.
From POC to Production
A few things the repo handles that most tutorials skip, and that matter if you take this further:
- It uses real S3. Validating against actual S3 instead of a local MinIO substitute means what you test locally is the genuine Loki↔S3 integration you'll run in production — not a lookalike that behaves differently under real latency and IAM.
- Least-privilege IAM from the start. The manifests include an IAM policy scoped to just the bucket, not a wide-open key. ⚠️ The POC uses a static IAM access key for the local Kind cluster, which is fine for a throwaway. On EKS, switch to IRSA (IAM Roles for Service Accounts) so pods assume a role instead of carrying a long-lived key — the repo's EKS migration notes call this out as the main change. A static key mounted as a Secret is a credential that can leak; a role assumed via IRSA is short-lived and far harder to exfiltrate usefully.
- Cleanup is included. Both implementation guides end with teardown steps — delete the cluster, empty and remove the bucket, drop the IAM user — so a POC doesn't leave a live AWS bill or an orphaned IAM identity behind. Easy to forget, genuinely useful to have written down.
The repo ships two parallel implementation guides — one for macOS/Linux (bash/zsh), one for Windows PowerShell — covering the same ten steps with identical manifests, just different shell syntax. There's also a PIPELINE_ARCHITECTURE.md that's pure reasoning, no commands, if you want the why before the how.
Worth Your Time?
If you're running anything on Kubernetes and your logging bill is creeping up, this is a well-constructed reference for the Loki pattern done properly. It's a POC, so it's a starting point rather than a drop-in production system — but it's the rare example repo that gets the unglamorous parts right: real object storage, scoped IAM, a migration path, and a cleanup script. Clone it, read the architecture doc first, and run it against a scratch AWS account to see the chunks land in S3 yourself.
Credit to Soumen Bhattacharjee for putting together a POC that's actually honest about its tradeoffs — which is more than most logging tutorials manage.