How One Fair Tweak Can Flip a Database Benchmark Leaderboard

A benchmark number drops, and within a day half your feed is repeating it: engine X demolished engine Y, here's the chart, end of discussion. The number feels objective. It's a measurement, after all.
The trouble is that a database benchmark almost never measures the one clean thing it appears to. Picture a footrace where the official rules quietly require each runner to also balance a glass of water on their head — and the rulebook never mentions the water. The person who crosses first isn't the fastest sprinter; they're the one who happened to be best at not spilling while running. Change how full the glass is, and a different person wins, even though nobody actually ran any faster or slower. Every runner was honest. The hidden constraint did all the deciding.
Database benchmarks are full of glasses of water nobody mentions, and the problem gets worse the moment you line up engines that were built for genuinely different jobs. There is no such thing as a perfectly neutral one. What follows walks through exactly how a fair-looking benchmark quietly hides its deciding factors, using a public benchmark most people already trust — and the lesson is about benchmarking as a whole, not this particular tool.
The benchmark under the microscope is ClickBench, a well-built and widely cited comparison for analytical databases with a deep roster of engines already wired up. That's the only reason it's here — it's convenient and respected, not because it's worse than any other. Every criticism below is aimed at the act of benchmarking, not at ClickBench specifically.
How ClickBench Measures Things
ClickBench runs the same workload against every system: a single web-analytics table of ~100 million rows and 105 columns (the hits dataset), and 43 analytical queries over it. Each engine ships shell scripts that install the database, load the data, and run the 43 queries. Each query is measured two ways:
- Cold run — first execution, with OS page caches and database caches cleared beforehand. The worst case, nothing warm.
- Hot run — each query runs three times; the smaller of the 2nd and 3rd runtimes is used. The first run populates caches, so the later two are expected to be fastest.
⚠️ The cold definition hides an asymmetry the public dashboard doesn't advertise, and it's worth knowing before you ever compare cold numbers. Clearing the OS page cache and restarting the server is only possible when the database runs on the benchmark machine. A managed cloud service (Snowflake, BigQuery, Redshift, Databricks) runs on the provider's hardware — the harness has no shell, no drop_caches, no way to bounce the server. So a hosted service's three runs all hit the same live, never-restarted instance, and its "cold" number is never forced cold the way a self-hosted engine's is. That tilts the cold-run ranking toward hosted systems, and the combined score that folds cold runs in along with it. Every engine below runs self-hosted on the same box, so they all play by the same rule — but remember this the next time someone shows you cold-run numbers spanning hosted and self-managed systems.
The analysis below uses hot-run results only, and only the overall score, not individual queries. The score works like this: for each query, ClickBench computes a ratio against the fastest system on that query.
ratio = (0.01 + hot_time) / (0.01 + baseline_time)
baseline_time is the best hot time among the compared systems for that query. The 0.01 is a 10 ms cushion so sub-10 ms queries don't dominate. The final score is the geometric mean of those ratios across all 43 queries. Lower is better; a hypothetical 1.000 means "fastest on every single query." Failed queries are penalized heavily.
⚠️ Here's the subtlety that drives the whole thing. Every ClickBench query script records the engine's own internal query time — DuckDB's Run Time, ClickHouse's --time, DataFusion's Elapsed, QuestDB's timings.execute, Polars' internal elapsed. Process and client startup is in nobody's recorded number. So keeping a process alive can't change the score by removing a startup term, because that term was never in the number. It can only change the score through process-local cache warmth. Hold onto that — it's the crux.
The Test Stand
ClickBench's reference runs use a c6a.4xlarge AWS VM. These don't. Every number below was measured on a single box: AMD Ryzen 9 7900 (12c/24t, 64 MiB L3), 61 GiB RAM, NVMe SSD, Ubuntu 24.04. Because the hardware differs, don't compare these absolute numbers to the public dashboard — the only thing that matters is the re-ranking within this box, where every engine sees the identical machine. The most trustworthy number is always the one you measure yourself.
Exact versions matter for reproducibility, and they move fast:
| Engine | Version | Notes |
|---|---|---|
| DuckDB | 1.5.4 | installs latest |
| ClickHouse | master 26.6.1.909 |
installer pulls master |
| DataFusion | 53.1.0 | built from source |
| Salesforce Hyper | tableauhyperapi 0.0.25080 |
latest on PyPI |
| Polars | latest on PyPI at run time | not pinned upstream |
| CrateDB | 6.3.3 | bumped to latest stable |
| QuestDB | 9.4.3 | bumped from 9.3.1 (see below) |
Scenario 1: The Parquet Tiling Competition
Start simple. There's a single ~14 GB Parquet file, and we query it. Five engines that read external Parquet directly: DuckDB, Polars, ClickHouse, DataFusion, Salesforce Hyper. Four spin up a fresh CLI or Python process for each query. Polars is the exception — ClickBench drives it as a long-lived session. That matters in a moment.
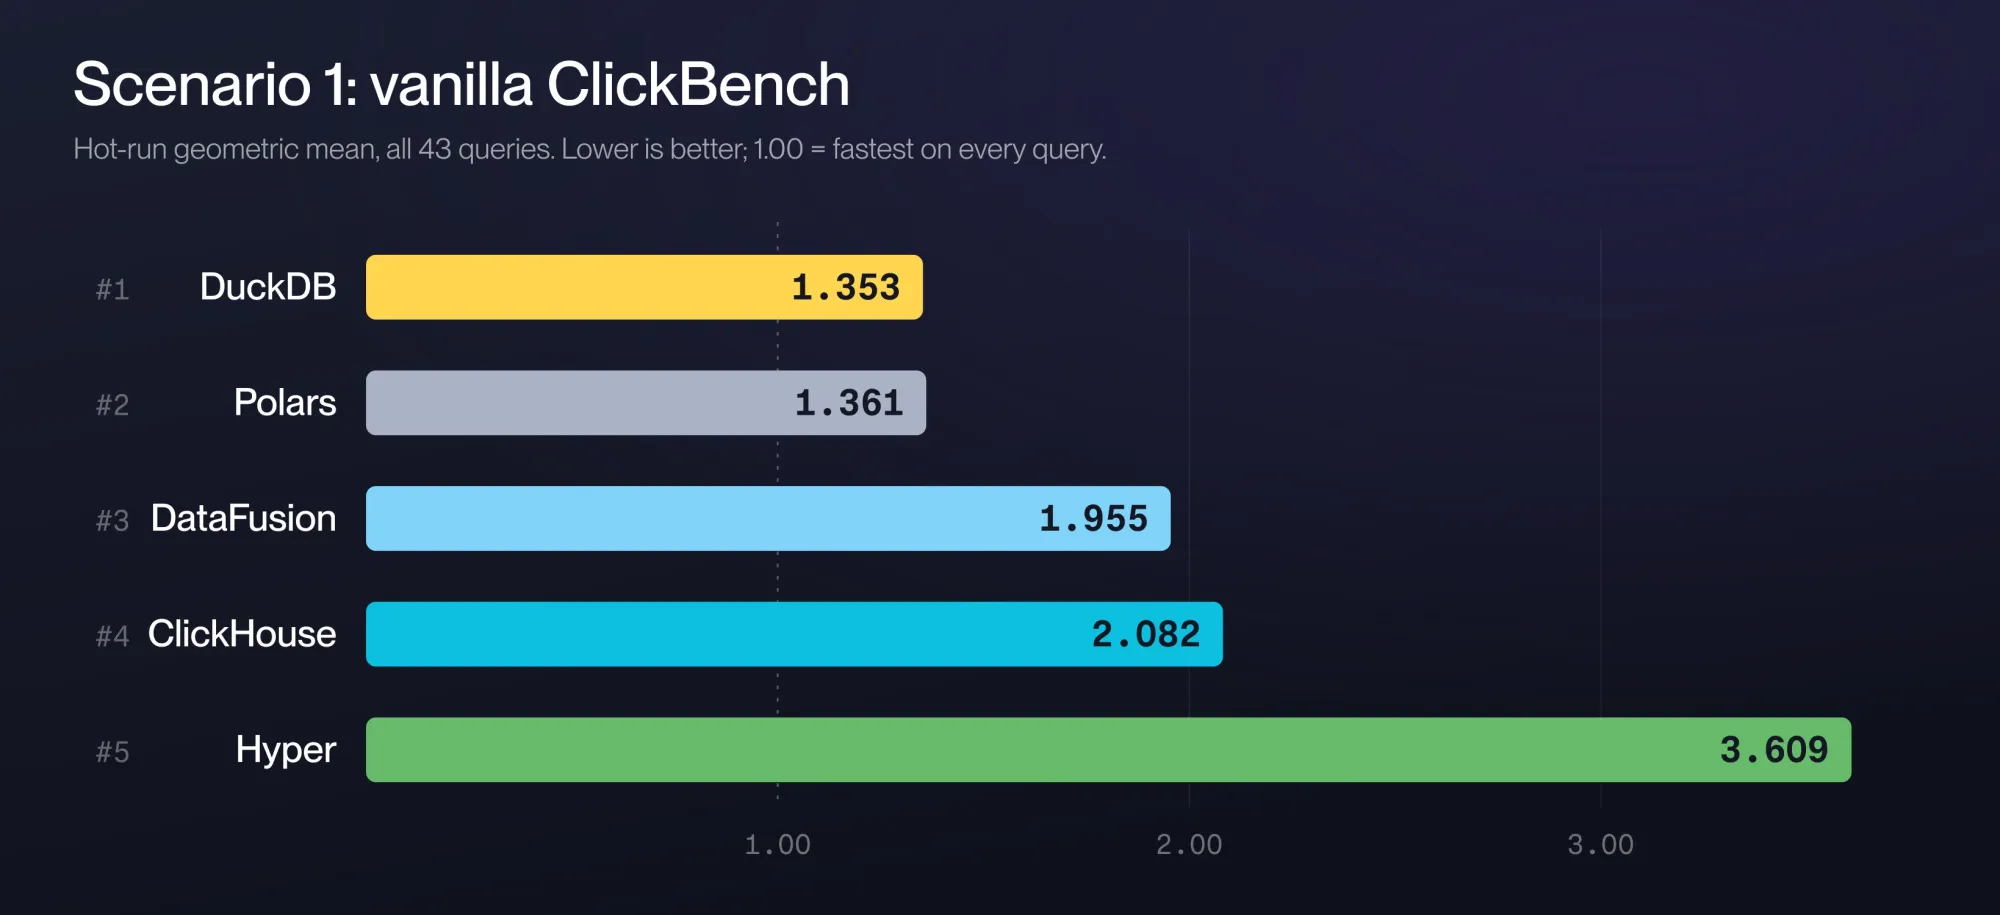
Vanilla ClickBench result on this box:
| rank | system | hot score |
|---|---|---|
| 1 | DuckDB | 1.353 |
| 2 | Polars | 1.361 |
| 3 | DataFusion | 1.955 |
| 4 | ClickHouse | 2.082 |
| 5 | Hyper | 3.609 |
DuckDB and Polars lead, nearly tied. DataFusion and ClickHouse sit in the middle. Hyper trails badly. Case closed?
The Elephant in the Room
Is it fair to restart the CLI or Python process on every query execution? That's an open question — ClickBench issue #936, "Hot runs are measuring cold times." For some engines the runs labeled "hot" are really cold starts, because the script restarts the process every iteration.
In real life, an analyst opens a DuckDB session or a notebook and keeps it around — the process stays warm. That's also exactly how client-server databases are always measured, since the server doesn't go anywhere between queries. So change one thing: keep each engine's process alive across the repeated runs. Nothing else changes — same internal timing method, same Parquet file, byte-for-byte identical queries. Only persistence changes.
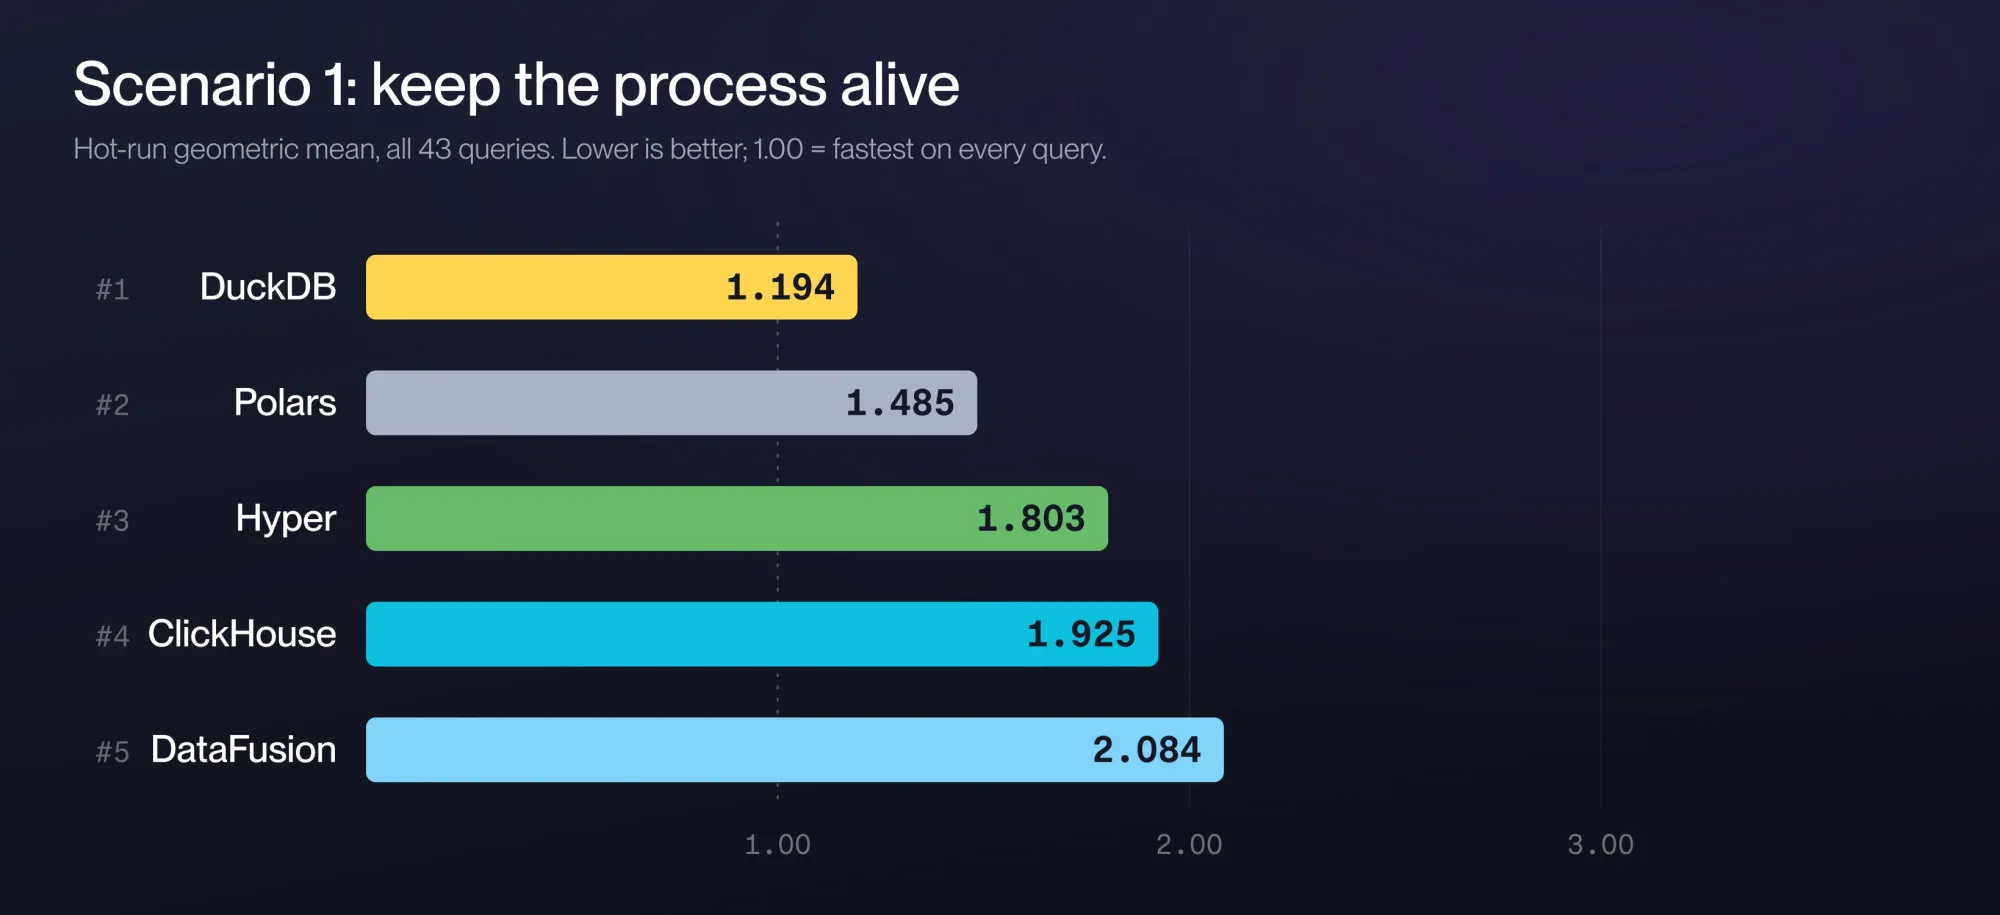
| rank | system | hot score |
|---|---|---|
| 1 | DuckDB | 1.194 |
| 2 | Polars | 1.485 |
| 3 | Hyper | 1.803 |
| 4 | ClickHouse | 1.925 |
| 5 | DataFusion | 2.084 |
One caveat on the speedups quoted below: each is that engine's own query time improving (per-query geometric mean of original time over keep-alive time). That's a different measurement from the bar scores, which rank each system against the fastest per query. So a speedup won't equal the ratio of an engine's two bars — and an engine can post a speedup while its score gets worse.
Hyper went from dead last to third — the biggest mover (2.17x faster). This was a genuine surprise: Hyper's per-call process spawn and table setup happen outside the timed region, so keeping it alive "shouldn't" change the recorded number. Wrong. The timed query execution itself carries first-query costs in a fresh process — query compilation, a cold buffer pool, Parquet metadata warmup. Those evaporate once the process persists, and they were never the startup term assumed excluded. ⚠️ The lesson: even when you think you know exactly where a benchmark spends its time, a fresh process can hide warmup inside the part being measured.
DuckDB stayed on top and got faster (1.24x). Its create.sql enables parquet_metadata_cache — a cache a fresh-process-per-query harness can never populate. ClickBench turns on a cache its own driver defeats. Give DuckDB a persistent process and the cache finally works.
DataFusion barely moved (1.03x), so it sank from third to last. It didn't get slower — everyone around it pulled away, and a ranking is relative.
Polars is the clearest illustration. It's byte-for-byte identical in both runs — ClickBench already drives it as a persistent session, so the tweak does literally nothing to it (1.00x). Yet its score got worse, 1.361 → 1.485, dropping it from near-first to clear second. Why? The score is a ratio against the fastest system per query, and the systems around Polars got faster. The baseline moved underneath it. A database can score worse on this benchmark while executing the exact same work in the exact same time. Hold that thought.
Scenario 2: Let Everyone Warm Up
Now switch to native storage — each engine loads the data into its own on-disk format first. Contenders: DuckDB, ClickHouse, QuestDB, CrateDB. These were picked because their vanilla scores sit close enough that one fair tweak can plausibly reorder them. CrateDB is the exception — it scores nowhere near the others but earns its seat as a second JVM engine alongside QuestDB, so the warmup effect doesn't rest on QuestDB alone.
The mix splits on compiler strategy. DuckDB and ClickHouse are C++ with ahead-of-time compilation. QuestDB and CrateDB run on the JVM, where a JIT compiler optimizes hot paths as the process runs. That difference is about to matter. There's a second split too: ClickHouse, QuestDB, and CrateDB are client-server (server stays resident by nature); DuckDB is embedded and spawns a fresh process per query.
Vanilla result:
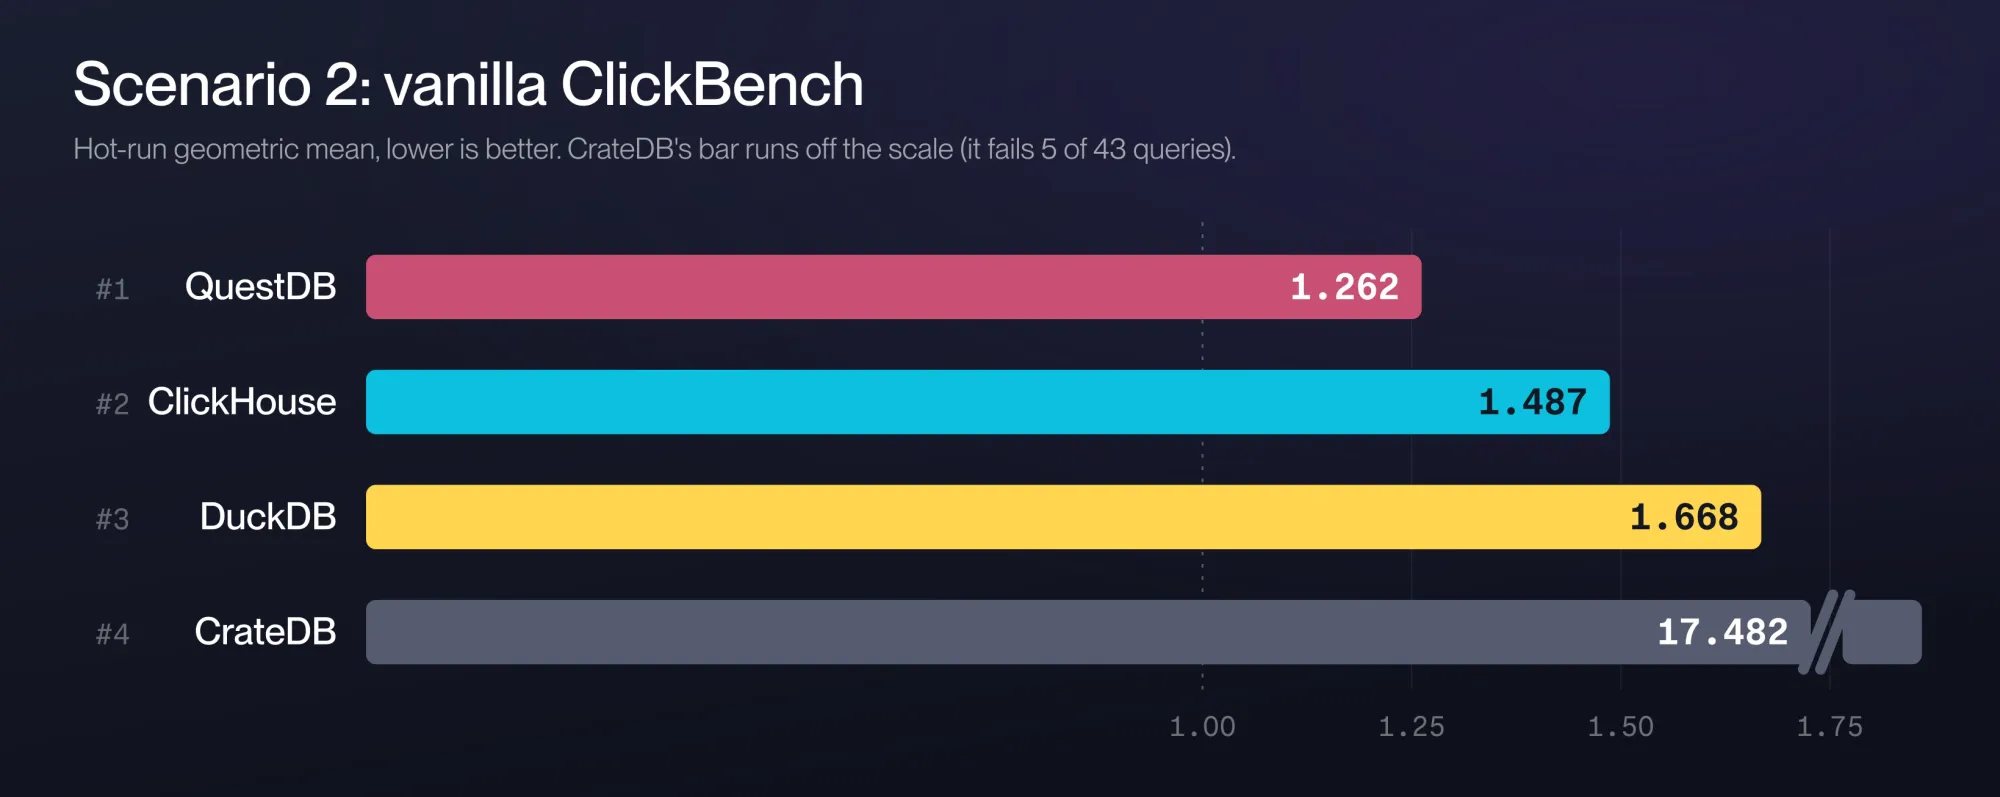
| rank | system | hot score |
|---|---|---|
| 1 | QuestDB | 1.262 |
| 2 | ClickHouse | 1.487 |
| 3 | DuckDB | 1.668 |
| 4 | CrateDB | 17.482 |
CrateDB sits far behind at 17.482, its bar off the scale. That's not a trick — it fails 5 of 43 queries on this box, throwing its own CircuitBreakingException on the heaviest distinct-aggregation queries, and ClickBench penalizes missing results heavily. Reported honestly across all passes.
Tweak One: More Iterations
ClickBench issue #934: "3 hot iterations is insufficient for JVM-based engines." A JIT keeps optimizing as it runs, so three iterations can catch a JVM engine mid-warmup and report slower-than-steady-state times. And realistically — you don't run a query three times and restart your server. Traditional databases have uptimes of weeks or months. Bumping hot iterations to 10 compares every engine fully warmed up.
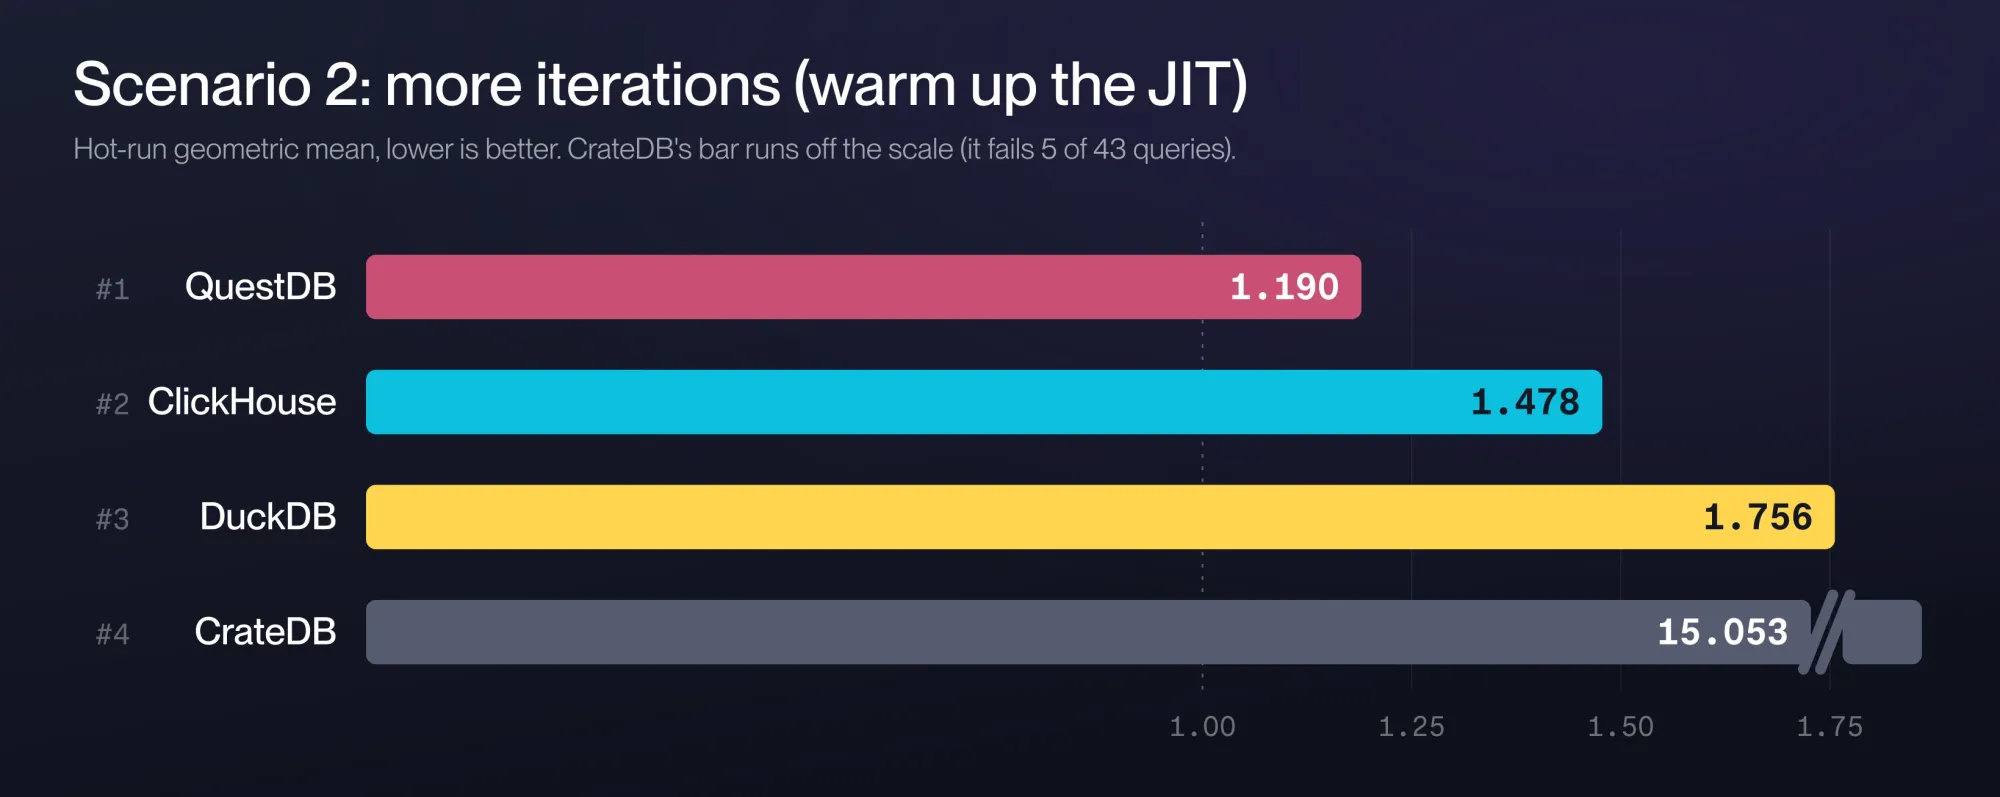
| rank | system | hot score |
|---|---|---|
| 1 | QuestDB | 1.190 |
| 2 | ClickHouse | 1.478 |
| 3 | DuckDB | 1.756 |
| 4 | CrateDB | 15.053 |
No re-ranking, but the numbers tell the story. The JVM engines warmed up and got faster: QuestDB 1.13x, CrateDB 1.27x (its score drops 17.482 → 15.053, though it still fails the same five queries). AOT-compiled ClickHouse was essentially flat at 1.07x — exactly what you'd expect from code already fully compiled before the first query. DuckDB couldn't warm up at all (still a fresh process per query here).
⚠️ QuestDB was already first, so warmup just padded its lead — but the close-race implication is the real point. Had a rival been only narrowly ahead in the vanilla run, this same ~13% JVM warmup would have been enough to de-crown it. Warmup is a re-ranking lever for close races; it just leaves a clear leader in place, which is why it changed nothing here.
A fair disclosure, and the part of this piece worth respecting most: QuestDB runs on the JVM, so this change flatters them, and issue #934 is one they opened. Normally that's a red flag — a vendor pushing a benchmark change that happens to help it. Their own advice: treat it with the same suspicion you'd apply to anyone else's. Two things make the case anyway. First, it's not a QuestDB special case — every JVM engine gains, CrateDB included. Second, the other lever in this piece (keeping a process alive) helps DuckDB and not QuestDB, and they're for switching that on too. The argument is for changes that make the benchmark more realistic, not ones that only lift one bar.
Tweak Two: Keep DuckDB Alive Too
Stack the Scenario 1 trick on top: 10 iterations and keep DuckDB's process resident so its native storage stays warm in the buffer pool.
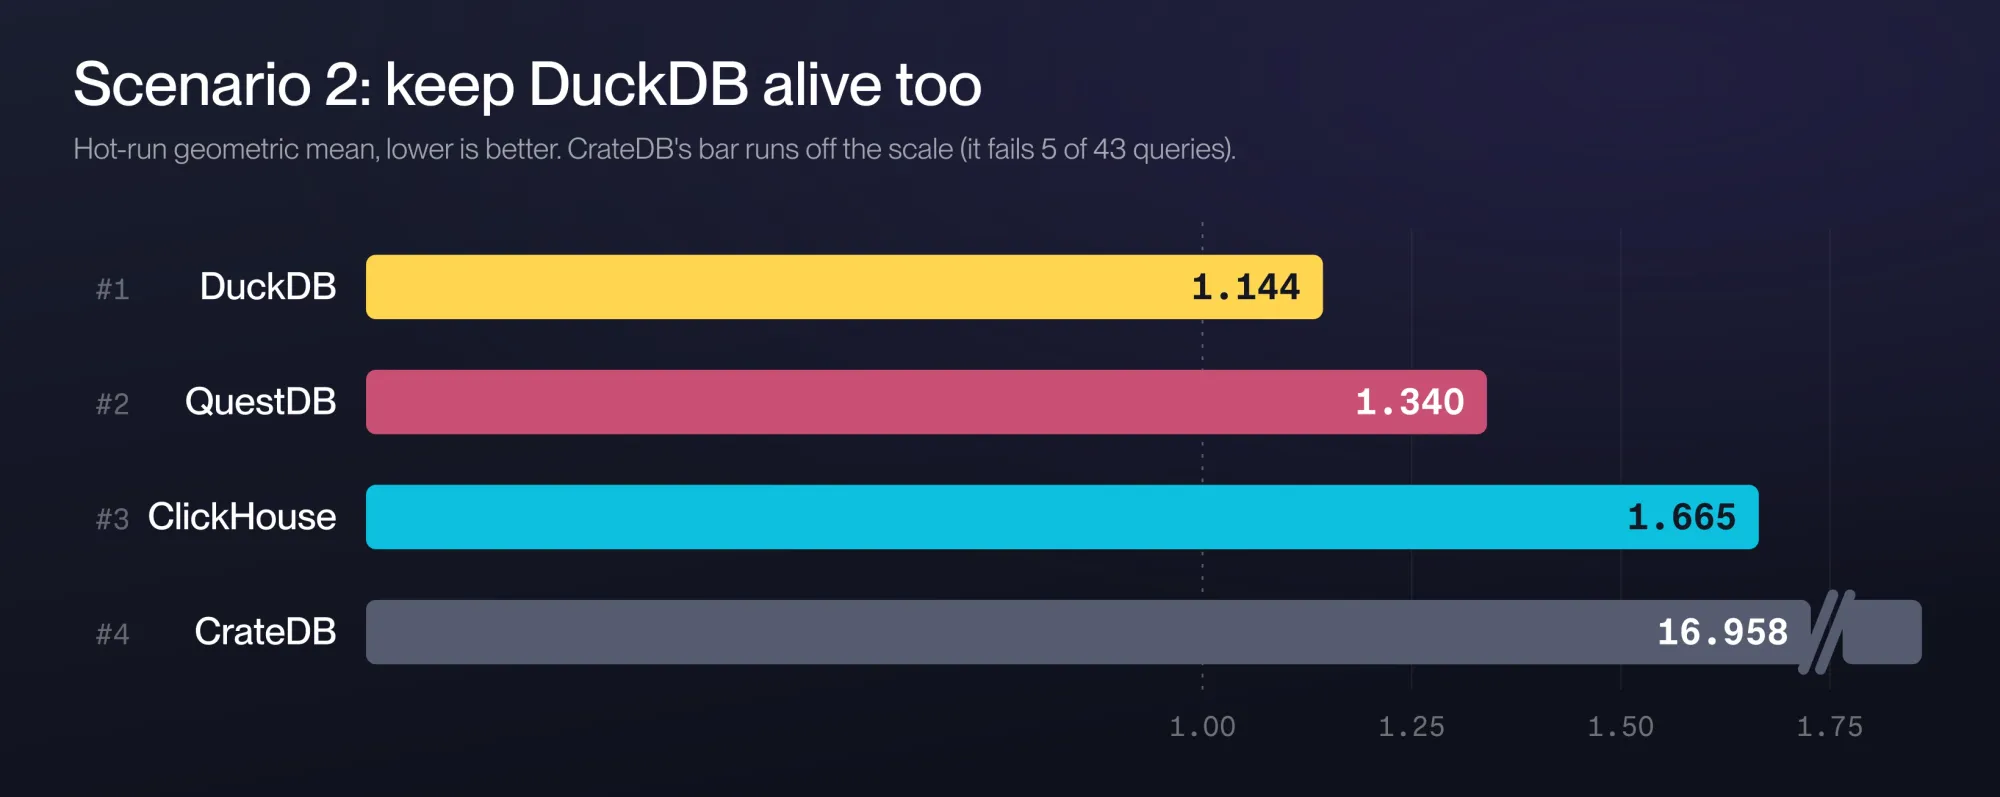
| rank | system | hot score |
|---|---|---|
| 1 | DuckDB | 1.144 |
| 2 | QuestDB | 1.340 |
| 3 | ClickHouse | 1.665 |
| 4 | CrateDB | 16.958 |
There it is. Keeping DuckDB resident makes it 1.69x faster (native buffer-pool warmth pays off even more than the Parquet metadata cache did), vaulting it from third to first, ahead of QuestDB. Same machine, same queries, same data. One fair-but-different knob.
And notice QuestDB's score: it rose from 1.190 to 1.340. QuestDB didn't slow down — its 10-iteration times are identical to the previous chart. It's the Polars effect again: the per-query baseline got faster once DuckDB sped up, so every other system's ratio drifted upward without any of them changing a thing (CrateDB climbed 15.053 → 16.958 for the same reason). Glance only at QuestDB's number across the two charts and you'd conclude it regressed. It didn't — only the baseline beneath it moved.
So Are We Doomed?
Not quite. The claim isn't that all benchmarks are useless — it's that none should be fully trusted. ClickBench says so itself, right in its rules: take results "with a grain of salt."
A tiny nuance hidden in benchmark source code can change the ranking dramatically. None of the scenarios above cheated — not a single query, timing method, or row of data was touched. Only two things changed: whether a process stays alive, and how many times a query runs. Both are defensible, arguably more realistic than the defaults, and both reshuffled the leaderboard.
⚠️ So when you see the next "we beat every competitor in benchmark X" post, don't rush to judgment. Look at the exact scenario and ask whether it resembles how your application actually talks to a database. If it doesn't, and you're choosing an engine, you're far better off with your own measurements on your own workload. That's hard to get right, but it's the only result that's truly about you. If that's too much, at least read more than one benchmark instead of a single number. And this applies to vendor benchmarks too — including the ones published by whoever's telling you to distrust everyone else's.
The honest takeaways for anyone actually selecting a database:
- Match the benchmark to your access pattern. A keep-process-alive benchmark models an analyst's warm session; a fresh-process-per-query benchmark models a cold serverless invocation. They're different workloads and they produce different winners. Neither is "wrong" — but only one resembles your deployment.
- A relative score can move without the engine changing. The baseline-shift effect (Polars, then QuestDB) means a system can look worse on paper while doing identical work in identical time. Never read a single score as an absolute statement about an engine's speed.
- Warmup model matters for JVM engines. Three iterations under-measures a JIT-compiled engine. If you run JVM-based databases with month-long uptimes, the steady-state number is the honest one, and a short benchmark won't show it.
- Cold numbers across hosted and self-hosted systems aren't comparable. The harness can't force a managed service cold. Don't put those numbers in the same column.
Bottom Line
The most trustworthy benchmark is the one you run yourself, on your hardware, with your workload. Everything here is reproducible — the harness and every result file are in the clickbench-experiments repo; clone it and see what your machine does to the rankings. Read every benchmark closely, ask whether the scenario looks like your production access pattern, and treat any single leaderboard number — vendor's or otherwise — as the start of an investigation, not the end of one.